Consumer survey 2024: operators’ Net Promoter Scores have rebounded as price rises ease
17 September 2024 | Research
Article | PDF (2 pages) | Fixed Services| Mobile Services| Video, Gaming and Entertainment| Fixed–Mobile Convergence
"Our 2024 survey results suggest that operators have some latitude to increase tariffs without impacting customers' overall satisfaction."

In August 2024, we completed the primary stage of our annual consumer survey. We will publish many more reports on this data (last year we published over 30 items and will produce a similar number this time around).
This short piece summarises some of our initial findings.
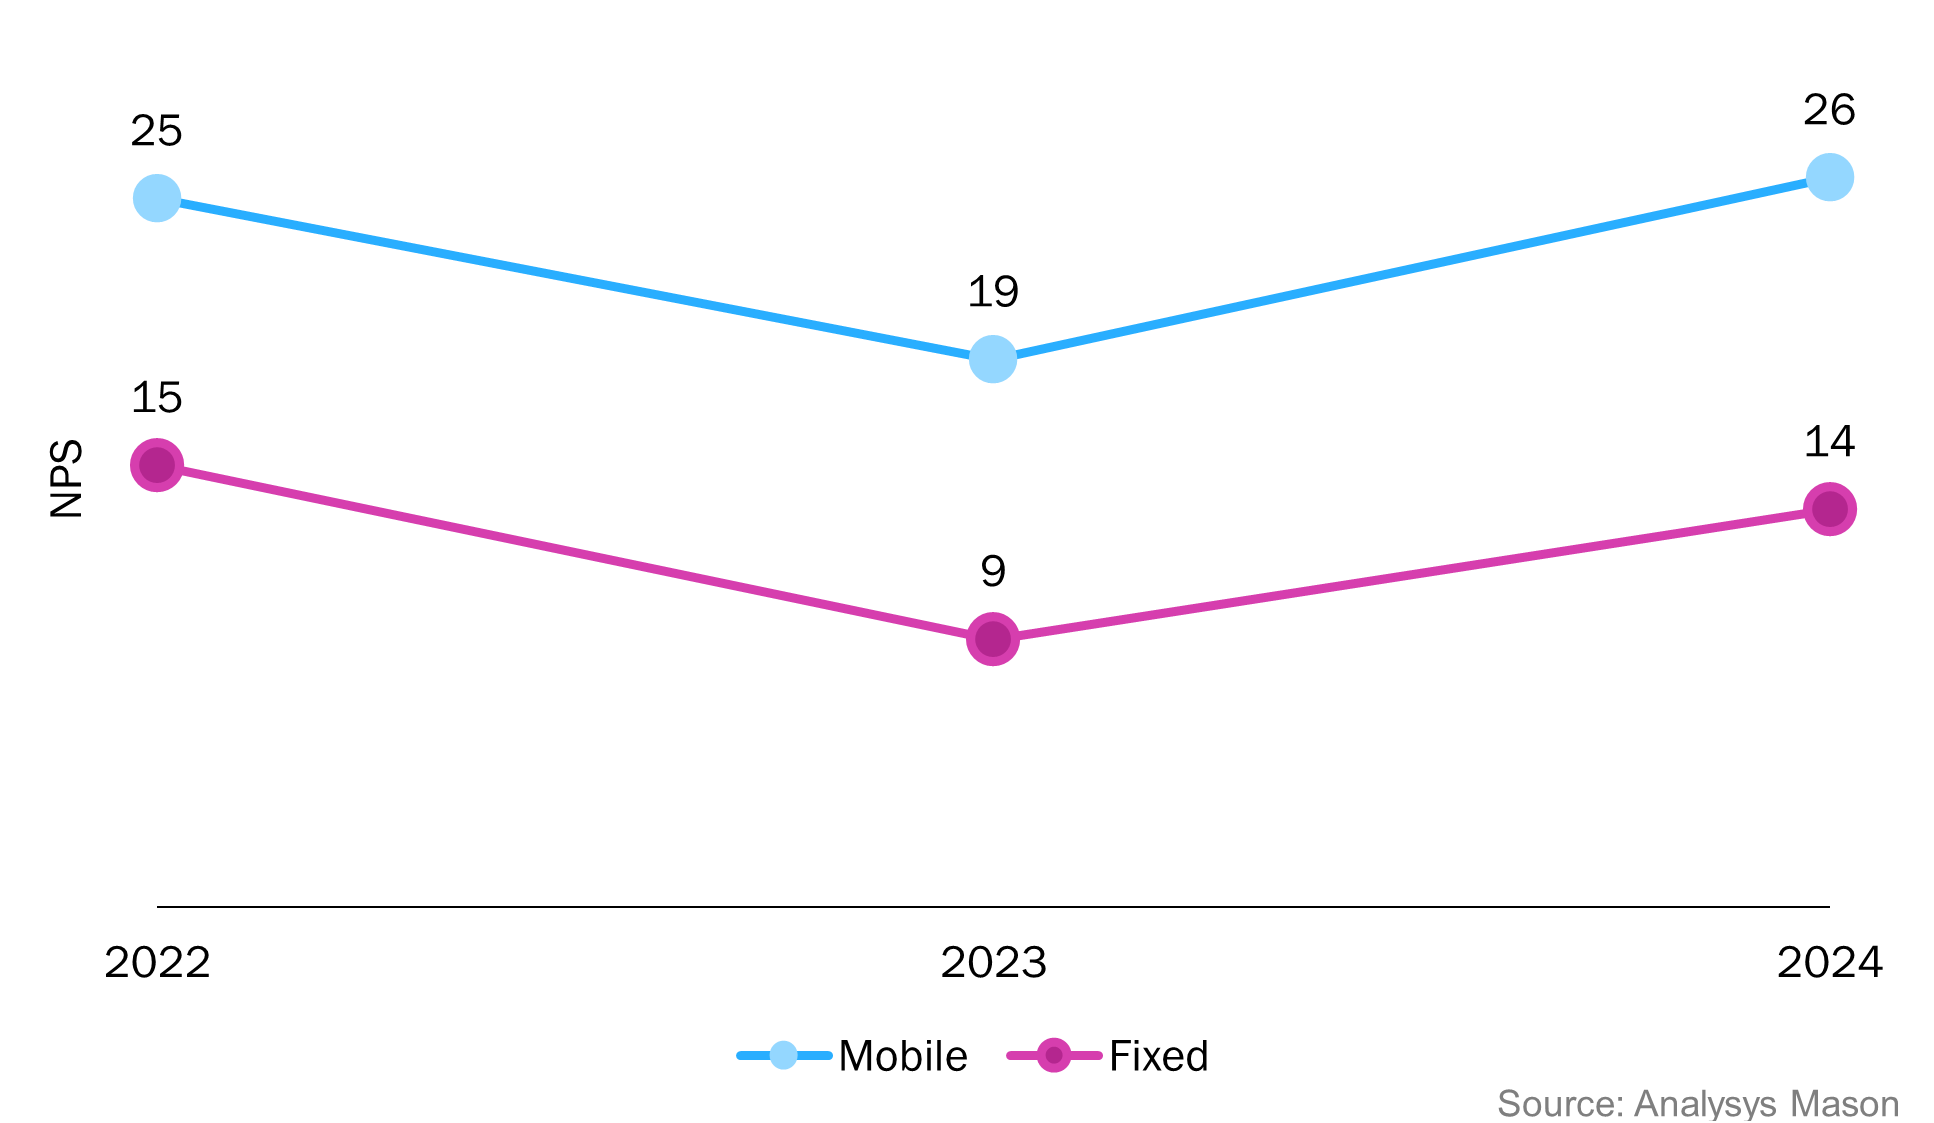
- The negative effects of price rises on Net Promoter Scores (NPSs) have worn off. In 2023, we saw a big drop in NPS levels, largely due to consumer dissatisfaction with higher prices. Operators have continued to increase their prices, but by more modest amounts, and NPS is back to 2022 levels (Figure 1). For example. EE (UK) raised tariffs by 7.9% in April 2024, compared to 14.4% a year before. Our survey results suggest that operators have some latitude to increase tariffs without impacting overall satisfaction, so long as the rises are relatively modest. The trend of improving NPS was not uniform though – scores were lower in both Australia and New Zealand in 2024 versus 2023, while in the USA, the results in 2024 were little improved over 2023. Operators still need to act cautiously when raising prices.
Figure 1: Average NPS across 16 countries worldwide, fixed and mobile services
- Mobile services outperform fixed services, but the comparison is not especially useful. Mobile services receive a higher NPS than fixed services in all but one of our survey countries (Malaysia is the exception; NPSs there are similar for both services). We suspect the scores only partly reflect greater satisfaction with mobile connectivity. In many countries, customers have more choice for mobile than fixed services and switching is easier for mobile than for fixed services, factors that should lead to greater satisfaction. However, results also reflect users’ satisfaction with their mobile device (almost always an Apple or Android smartphone). Fixed connectivity, used with many different devices, does not have such a clear connection to a single device. As a result, NPSs for fixed services may better reflect the customers feelings about the connectivity and their service provider.
- More-for-more strategies are getting harder to sell. Over 50% of US mobile customers have access to unlimited mobile data.1 In Spain, 60% of customers have a fixed broadband service that offers at least 350Mbit/s (typically a 500Mbit/s or 1Gbit/s connections) – easily enough bandwidth to meet the demands of today’s applications. Other countries are catching up rapidly (in Ireland, for example, the share of fixed customers on 350Mbit/s or more went up by 9 percentage points to 53% between 2023 and 2024). Pushing through tariff increases on the back of offering customers more mobile data or higher fixed speeds is becoming almost impossible; operators need new strategies (for new strategies on upselling customers who already have unlimited data, see Analysys Mason’s Beyond unlimited data plans: case studies and analysis.
- Segmentation is the key to satisfaction. The five mobile service providers with the highest NPS are all mobile virtual network operators (MVNOs). Consumer Cellular, Tesco Mobile and ALDImobile do well, for the most part, because they offer plans that are squarely targeted at a certain customer demographic and they offer low prices for a limited amount of data. They do not have plans aimed at satisfying the whole market. Operators with sub-brands often see these outperform the main brand (for example, Skinny Mobile in New Zealand has an NPS of 32, well above its main brand Spark’s NPS of 10).
- The troubles are not easing for pay-TV services. The decline in pay-TV subscriptions is well-documented. The underlying issue with satisfaction is not so well recorded, but the contrast with streaming services is sharp. Even the worst performing streaming service has a higher NPS than the best performing pay-TV service in almost every country.2 For example, Sky’s pay-TV platform has a negative NPS in the UK, while Netflix scores 24, Disney+ 17 and Amazon Prime 11. The picture is similar elsewhere. If and when these streaming services include premium live sports content, the troubles for traditional pay-TV companies will only deepen.
- Netflix’s crackdown on account sharing is working. In 2023, 19% of Netflix customers in the UK were using account log-in details shared with others. In 2024, this figure had fallen to 11%.3 Netflix’s attempts to get more customers to pay for an account and not rely on shared access seems to be working. Disney+ and others are following suit.
The full list of our consumer survey reports is available here. As well as 19 reports on individual countries, we will also be publishing reports on separate topics, such as trends in satisfaction levels, fixed-wireless access (FWA), fixed–mobile convergence and usage of social media platforms.
1 With some restrictions, such as fair usage policies, but for most customers in most cases, these plans offer as much smartphone data as they will likely need.
2 In France, Free’s pay-TV offer is an exception; its NPS is 32, which compares favourably to Netflix‘s NPS of 24, the best performing streaming service in the country.
3 The actual figure for account sharing in both years is almost certainly higher because some respondents may not admit to access sharing (or may not be aware that they are on someone else’s account).
Article (PDF)
DownloadAuthor