The CAGRs of data traffic volumes and revenue in the satellite and space market

As satellite and space analysts at Northern Sky Research (NSR) (an Analysys Mason company), we know there are few truths in our market: Schedules almost always slip to the right; and the volume of data always increases. While others at NSR frequently comment on the schedules (see … nearly anything we publish), the second ‘fact’ requires further explanation. It is no doubt true that the amount of ‘data’ moving through space is at an all-time high – and will continue to grow over the next 10 years. However, an assumption that high data volumes translate to large total revenue does not always hold true.
Looking deeper, I want to highlight two key markets that frequently come up in conversations across NSR – satellite communications and earth observation. We will use two of NSR’s studies to dive a bit deeper into this trend: recently published NSR’s Global Space Economy, 2nd Edition, and NSR’s Satellite Traffic Study. These markets represent arguably the two ‘most common’ use cases for space-based infrastructure, yet how they approach the relationship between traffic volumes and revenue growth are very different.
The SATCOM paradigm
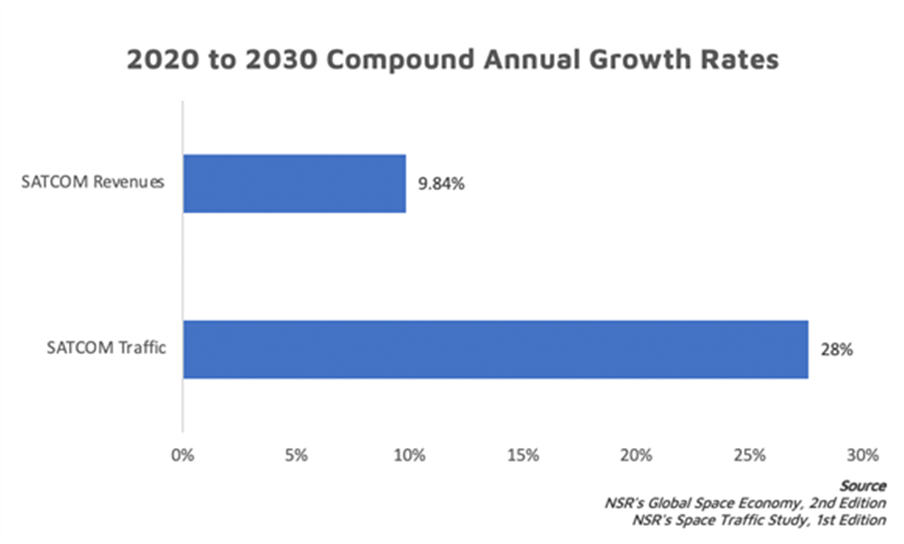
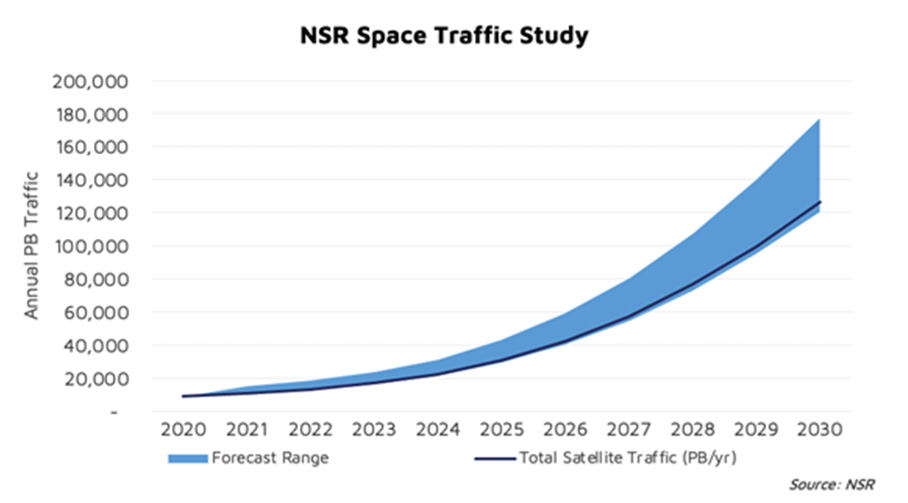
NSR’s Satellite Traffic Study points to the growth of traffic volume – from 8920PB per year in 2020 to more than 126 250PB per year by 2030, a CAGR of 28%. Most of that growth will come from satellite communications, which the recently released NSR’s Global Space Economy, 2nd Edition report (which also covers the same period of analysis) places at close to USD530 billion in cumulative revenue (growing at a 9.84% CAGR from 2020 to 2030).
Even without further analysis around under-the-curve trends such as higher-end markets like mobility or wireless backhaul ‘driving growth’ or the transformative impacts of non-GEO – growth rate analysis alone would lead one to believe that there is ‘trouble in paradise’. Now, these are not strictly ‘apples to apples’ datasets (our traffic data does not quantify the MSS S/L-bands for example, but we account for their revenue), but ‘price compression’ is a very real trend that affects business cases. Moreover, these are not isolated to ‘what do I price my Mbit/s? (or Mb/Gb/etc.)’ – it cuts across the entire infrastructure landscape.
When satellite operators make buying decisions (which NSR’s Global Space Economy report puts cumulative spending on satellite communications manufacturing and launch at USD126 billion), they are faced with the reality of more traffic volumes at lower revenue potential – and if/where/can ‘value-added services’ be leveraged to enhance per-megabyte revenue. In truth, the ‘most typical’ value-added service proposition in SATCOM is for satellite operators to become service providers and monetize their MHz directly to end users – not creating IoT services or customized user portals.
Investments in software-defined satellites highlight some of these trends more specifically. In short, the data volume versus revenue paradigm significantly alters the manufacturing landscape. These investments are no longer about high-margin video connectivity services, but instead require sophisticated infrastructure that maximizes total cost of ownership (also on the ground-segment/virtualization side).
Overall, for SATCOM at a top-level (which is the biggest source of space-based traffic volume) rapid data traffic growth is not subsequently producing similar growth rates for SATCOM revenue.
Earth observation
Focusing on CAGRs alone, earth observation traffic growth looks terrible – in fact, it is one of the lowest growth markets within NSR’s Satellite Traffic Study, second only to the CAGR for data requirements from satellite launches. While the earth observation segment yields nearly 4500PB of cumulative traffic volume (#2 behind SATCOM’s 500 000PB), the average revenue growth is nearly three times higher. In a market where the traffic volume growth is largely stagnant, what is enabling higher revenue growth CAGRs? More importantly, CAGRs in one metric do not necessarily give a good indicator for CAGRs in another.
In earth observation, as explores in our EO-focused Bottom Line post the “downstream activities that used EO/remote sensing and data analytics demonstrated an accelerated potential.” He explains that as more earth observation satellites are launched, it is not entirely the growth in sensor resolution, revisit rates, etc that are driving the market – but instead, the reuse and leverage of that data among a broad range of customer sets. Moreover, this market is, “far from commercialization, and the untapped markets will remain just that: untapped.”
With an average earth observation revenue growth at 12.15% between raw data to finished analytics products, one can expect a continuation towards small increases to earth observation traffic volumes with ‘big impacts’ on the CAGR of earth observation revenue. Even as new technology or infrastructure is introduced into the market, these will largely affect the revenue growth side of the equation more than pure ‘traffic growth’. As the earth observation business migrates away from ‘cost-per-bit’ metrics towards ‘value-added insights’, it can leverage what satellite does best – ‘multi-point economics’.
Putting it all together
Our industry takes great comfort in quantifying in-orbit satellite and space assets by their Gigabits per second. We still have not entirely moved away towards the age-old ‘fill rate’ construct. While this is a useful way to understand some of the technical capabilities of satellite A versus satellite B, it is by no means ‘the metric’ anymore. Big traffic volume growth does not necessarily mean big revenue growth. Sophisticated investments require sophisticated analysis.
As discussed in our reports, business models need to evolve. The proliferation of software-defined and software-enabled solutions across all segments of the satellite and space markets are radically changing the way the industry thinks about itself, where ‘value’ is created’, and what customers are actually buying – not what we think they want.
In short, these are perhaps some of the lowest hanging fruit take-aways – different markets approach revenue generation versus capacity consumption differently. Those differences, however, are critical in understanding the underlying trends, drivers, and restraints for each of these markets. The shift away from video in SATCOM has a tremendous impact across satellite operators to satellite manufacturers and ground segment providers.
Reselling raw data and analytics requires new business models and approaches to unlock the ‘next era’ of growth – if that’s even possible.
The bottom line
Thinking of the satellite and space markets in terms of data traffic volume is fun, no doubt about it. Creating any first-edition report is an intellectually challenging exercise that requires continuous model refinement. NSR’s Satellite Traffic Study puts a stake in the sand to start a conversation around just how much traffic moves through space-based infrastructure. Moreover, it requires your feedback to build our 2nd edition study, which will be published later in 2022.
Article (PDF)
Download