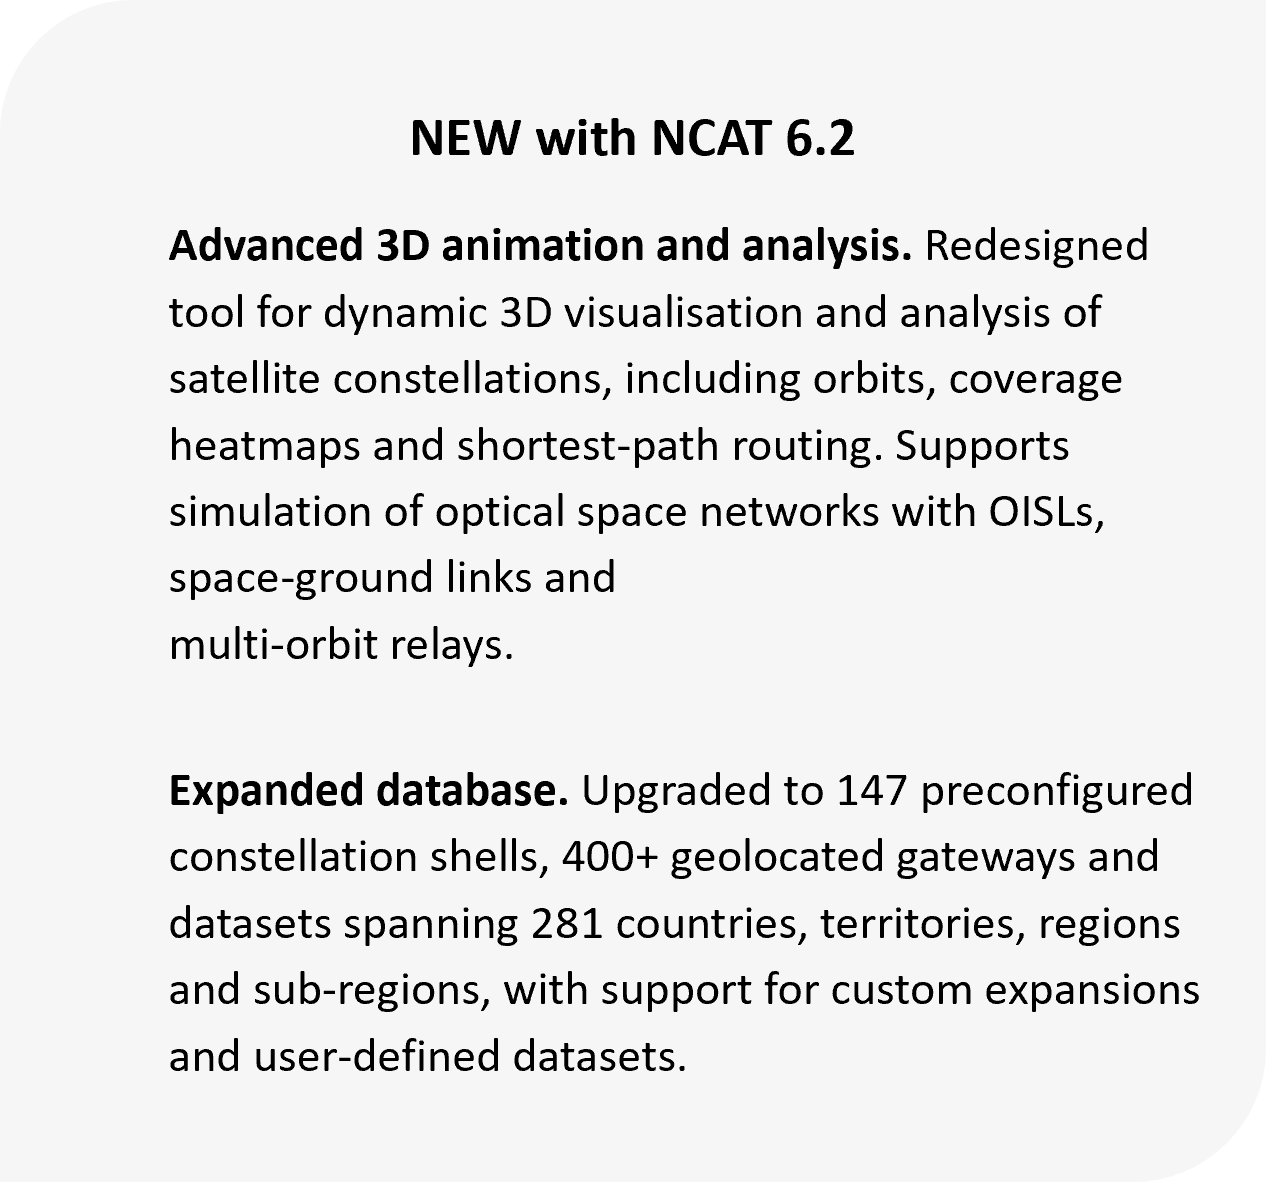
Non-GEO Constellations Analysis Toolkit 6.2
The Non-GEO Constellations Analysis Toolkit (NCAT) is the industry-leading platform for objective, data-driven, multi-level assessments of low-Earth-orbit (LEO) and medium-Earth-orbit (MEO) satellite constellations.
NCAT is delivered as a user-friendly web application with API endpoints, and it provides strategists, business leaders and technical professionals with reliable, data-driven and integrable competitive intelligence on the technical and commercial capabilities and impacts of non-geostationary (non-GEO) systems.
NCAT bridges the technical–business gap by combining diverse datasets, advanced analytics, AI and interactive visualisations to seamlessly explore:
- coverage and visibility persistence
- bandwidth supply and demand
- market addressability and opportunity
- business-case sensitivities
- satellite and launch statistics.
The platform allows users to easily calculate key performance metrics and to benchmark the competitiveness of satellite constellations, both against each other and relative to terrestrial networks, all without requiring deep technical expertise.
Toolkit coverage
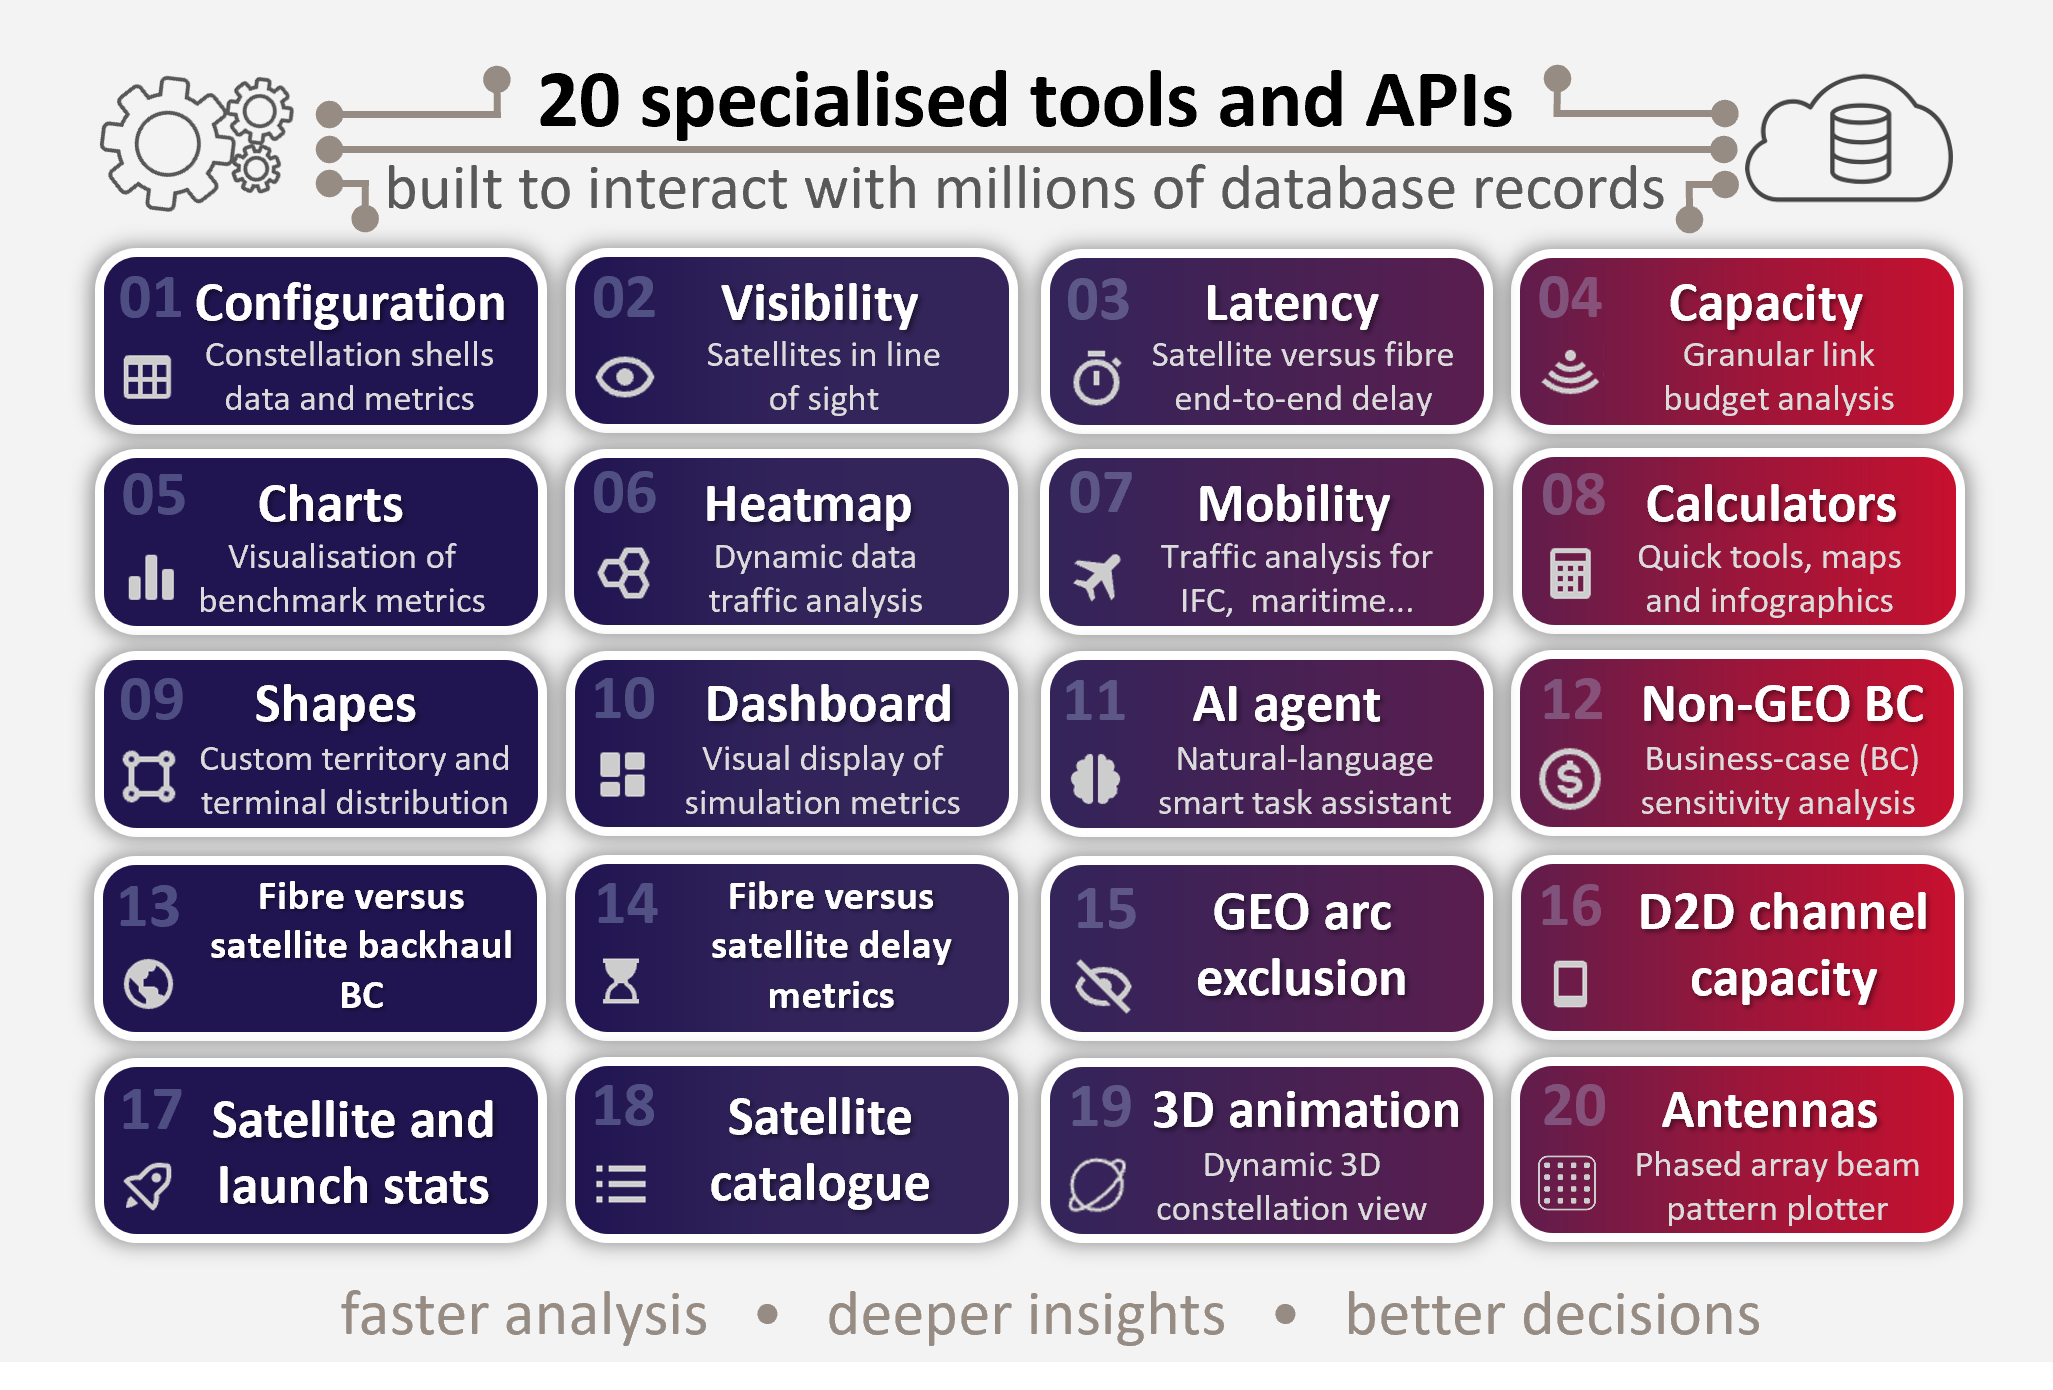
20 rigorously engineered tools and APIs interact with millions of queryable database records to deliver objective, data-driven assessments of constellation performance across multiple levels.
Millions of dynamic calculations are processed via an intuitive interface with configurable filters, visualisation controls and user-defined inputs. All outputs (data, charts, maps, AI reports and visualisations) are easily downloadable for further analysis or reporting.
Features included
- Precisely coded algorithms that drive factual analytics, visualisations and API responses for trustworthy results.
- A comprehensive, regularly updated database to ensure up-to-date simulations.
- Daily: in-orbit satellite counts and orbital observations are updated automatically every day.
- Weekly: the satellite catalogue is refreshed automatically each Sunday.
- Monthly: satellite and launch statistics are updated automatically every month.
- Quarterly: core software and database enhancements are made every quarter.
- Point-and-click interactivity. Users can easily navigate interactive maps and controls (layers, filters and settings) to drive dynamic calculations and visualisations with a few clicks.
- Multi-orbit, multi-band analysis. Users can configure simulations across orbital shells from one or multiple systems, thus enabling concurrent calculations for thousands of satellites across different frequency bands.
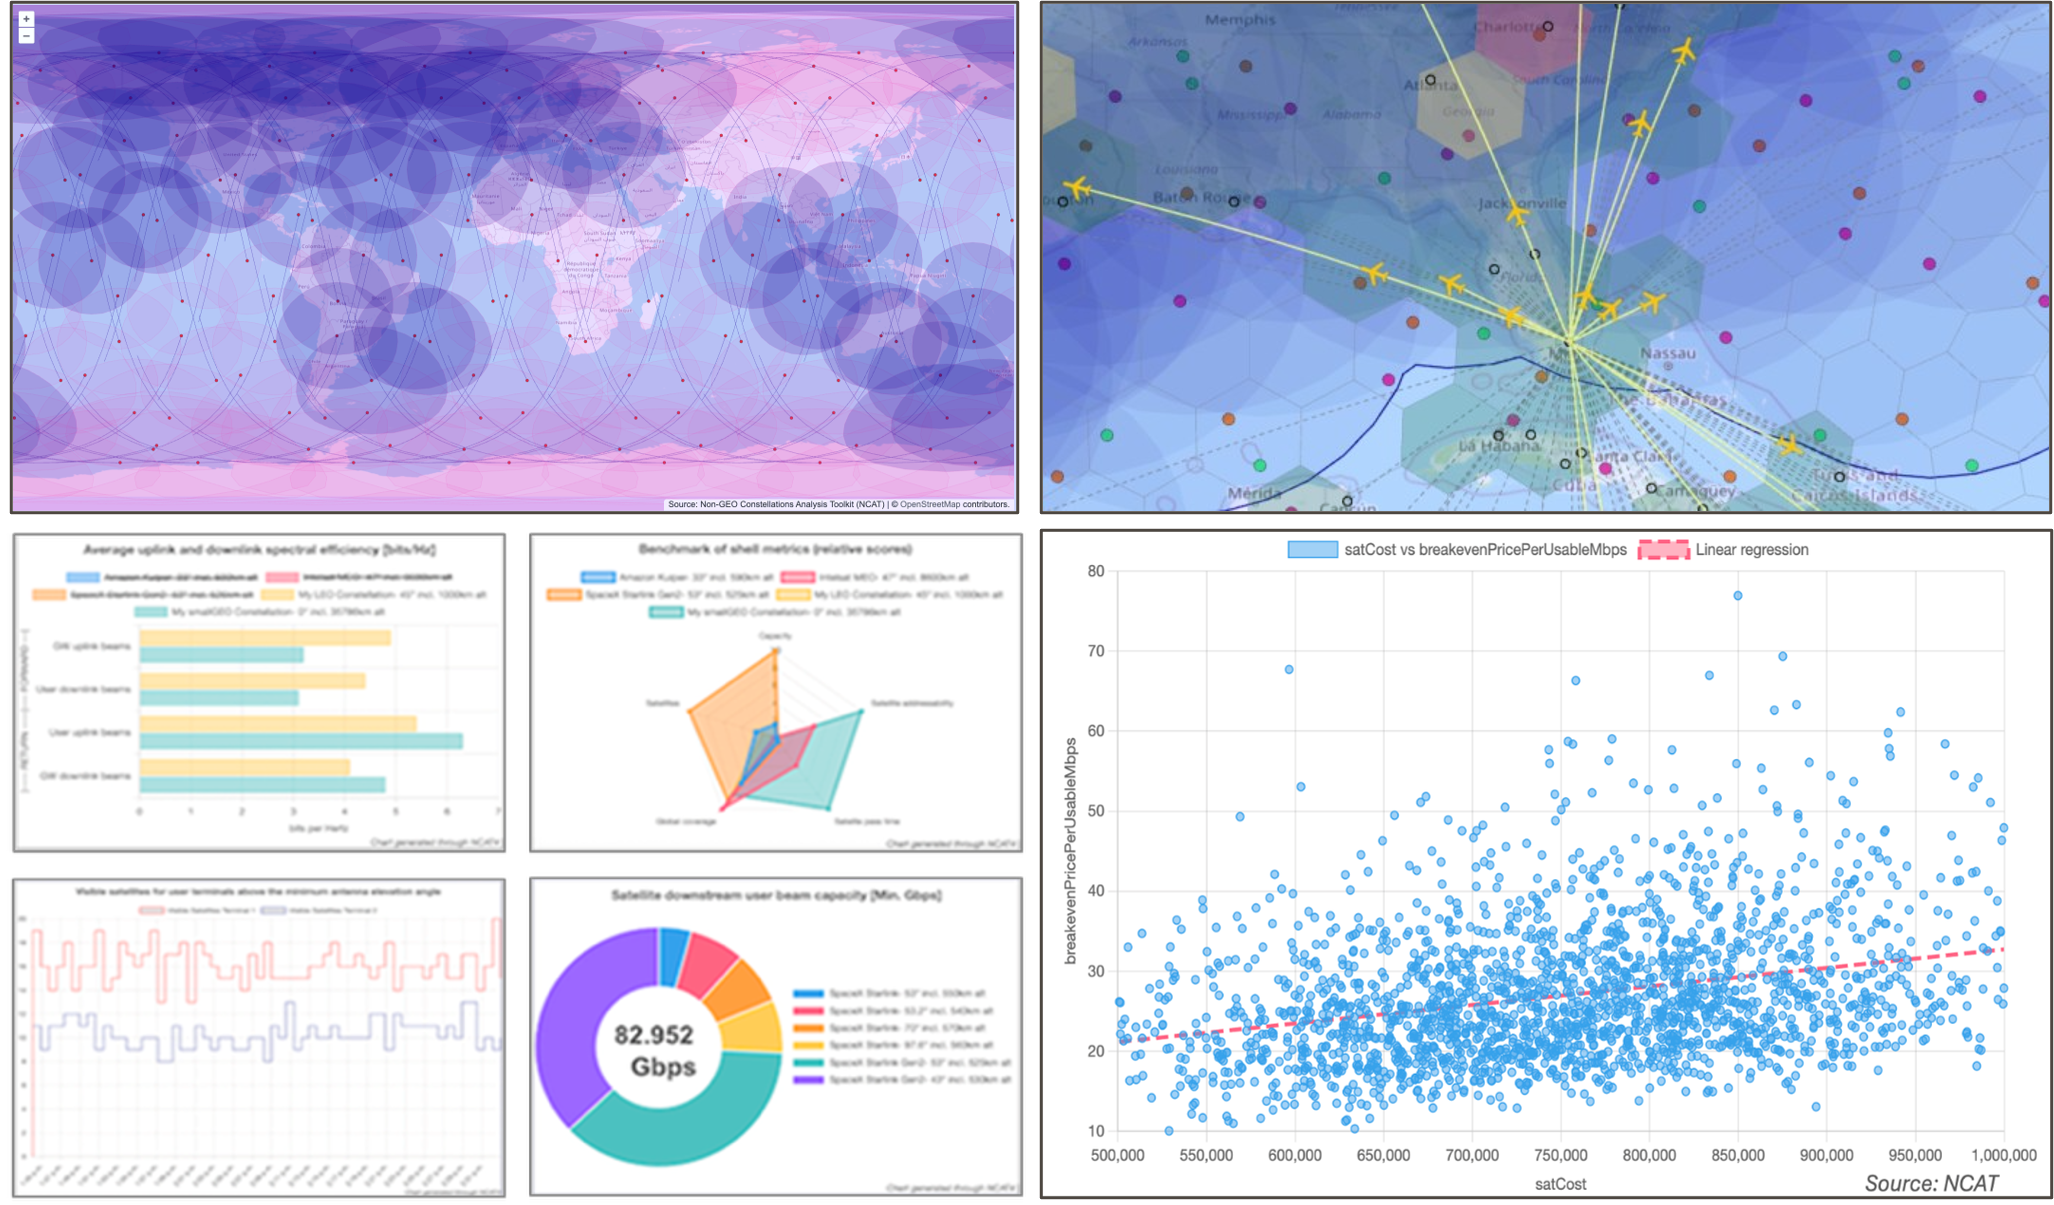
- Dynamic, animated visualisations. Users can view the real-time propagation of key conditions, including satellite positions, coverage footprints, visible satellites, antenna look angles, link latency variations and supply–demand dynamics.
- Space-time controls. The platform supports both real-time and accelerated time-lapse analysis at global, regional or local scales. Simulations can be sped up by up to 300×, thus enabling users to analyse a full day of constellation performance in around 5 minutes.
- Hexagonal ground grid. NCAT employs a dynamic hexagonal grid with country-level precision that is configurable down to city-scale resolution. The ‘Shapes’ tool enables users to define custom geographical areas beyond the countries and regions preloaded in the database.
- Concurrent IP throughput computations. NCAT performs concurrent link-budget throughput analysis across all user and gateway beams, accounting for combinations of user-terminal and gateway look angles.
- Flexible demand models. Users can choose from pre-set demand criteria or can define custom parameters (including user terminal distribution, exclusion zones and functional drivers of bandwidth demand) to tailor simulations to specific use cases.
- Demand-driven supply. Users can simulate dynamic reconfigurations of steerable beam capacity based on selectable fairness criteria to optimally match feasible supply with changing demand conditions.
- Mobility tool. NCAT supports a wide range of mobility applications (in-flight Wi-Fi, rail, maritime and connected vehicles) through user-defined schedules. It also integrates commercial flight data to assess in-flight connectivity (IFC) supply and demand.
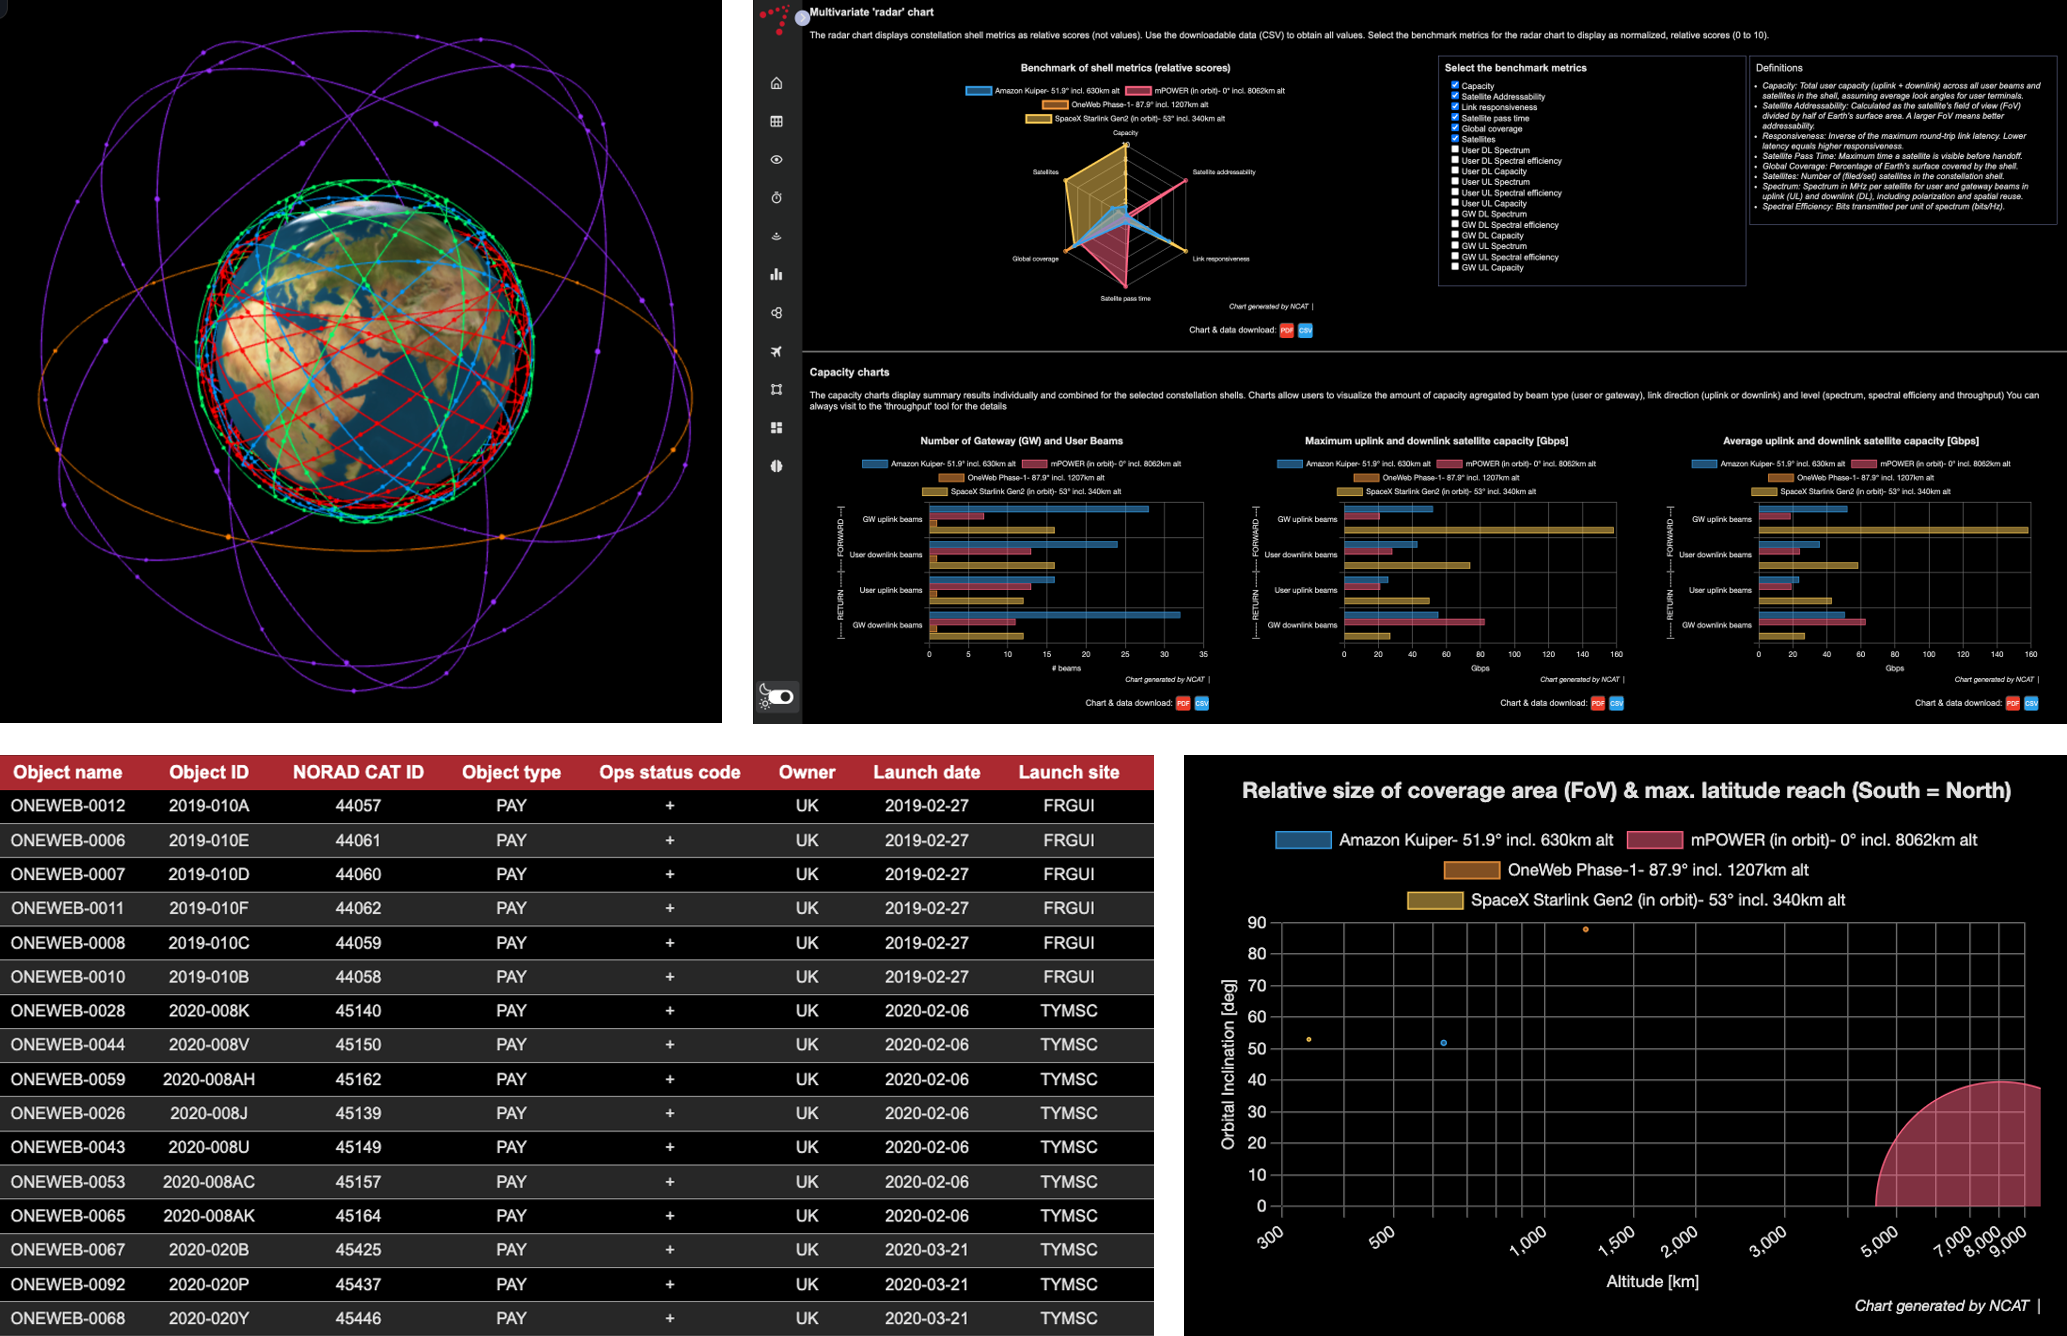
- Statistics. Users can access and process comprehensive catalogued data and satellite launch statistics, with configurable filters to explore data for all unclassified satellites ever launched.
- AI-powered report generation. The AI agent tool uses natural language to interact seamlessly with internal NCAT tools and datasets, enabling it to answer queries, generate professional reports and interpret simulation results quickly.
- Downloadable insights. All charts, maps, reports and infographics are downloadable (in PDF or PNG format). Output data is available in tabular CSV format for external analysis, including tables, chart data, benchmark metrics, time-stamped samples, terrestrial grids with supply and demand data, assessment summaries, flight routes, look angle statistics and more.
- Extensible. NCAT is extensible via RESTful APIs for integration into internal workflows and third-party systems.
| Applications | NCAT is primarily focused on satellite communications (satcom) but includes features to assess Earth observation (EO) and global navigation satellite systems (GNSS). |
| Tools | 20 configurable tools and APIs to analyse and benchmark constellations |
| Constellation shells | 140+ operational, planned and filed shells included (user editable and expandable) |
| Gateways | 400+ surveyed gateway locations (user editable and expandable) |
| Geographical regions | 280+ countries, territories and regions included (user editable and expandable) |
Questions answered
- How do current and future non-GEO architectures compare in terms of coverage, capacity, beam and satellites?
- What is the forward and return link capacity (spectrum, bandwidth and IP throughput) per beam and satellite?
- How many users can constellations support simultaneously, by country or territory?
- How is the capital cost per usable megabits per second determined?
- What is the business-case sensitivity to spacecraft manufacturing and launch costs?
- When will satellite communications constellations outperform fibre-optics in underserved communities?
- How does backhaul capex and opex affect the business case?
- How can bandwidth supply and demand be assessed based on configurable service plans, and where are the congestion hotspots?
- What is the maximum, average and minimum number of satellites in line of sight at each location?
- How does fibre latency compare with that of LEO systems, factoring in points of presence (POPs), optical inter-satellite links (OISLs) and link relays?
- What are the regulatory exclusion angles for non-GEO systems to avoid GEO interference?

Who should use this toolbox
NCAT is essential for any organisation that is aiming to operate in, understand, compete within, collaborate across or invest in the non-GEO space economy.
- Satellite operators (GEO, non-GEO, FSS and MSS/D2D)
- Spacecraft manufacturers and component vendors
- Terrestrial/wireless network operators (telecoms operators, MNOs, ISPs, towercos, IP transit providers and cloud services providers)
- Ground system vendors (terminals, antennas, hub/modems and SD-WAN)
- Teleport operators, satellite service providers and integrators
- Major non-GEO capacity users (such as governments, defence players, airlines and energy companies)
- Industry associations, research labs and institutions
- IT companies developing virtualised constellation architectures
- Regulators, space agencies and spectrum research firms
- Financial institutions and investment firms
Sample NCAT use cases
| Player type and department | Focus area and situation | How NCAT can help |
|---|---|---|
|
Satellite operator Chief strategy officer (CSO)'s office |
Competitive benchmarking and strategic positioning A multi-orbit satellite operator must refine its competitive response to LEO mega-constellations. |
NCAT enables rapid, data-driven simulations to benchmark the operator’s performance (in terms of latency, throughput and coverage) against other non-GEO competitors on a per-territory basis. These insights support high-stakes strategic planning and informed competitive responses in a fast-moving market. |
|
Telecoms operator and MNO Business development office |
Direct-to-device (D2D) and rural backhaul partnerships The operator needs to assess the opportunities and risks posed by D2D and FSS satellite broadband constellations. |
NCAT precisely measures the channel and beam capacity, coverage persistence and technical viability of current and upcoming D2D constellations. This can be used to inform strategic decisions on partnerships, investment and competitive positioning. |
|
National regulator Radio frequency spectrum management office |
Sovereign constellation assessment A national telecoms regulator is exploring architectural options for a sovereign non-GEO constellation. |
NCAT supports iterative design analysis to define a minimum viable architecture that meets national government, defence and broadband objectives. It enables both commercial and technical assessments to evaluate feasibility, sustainability and policy implications. |
|
Spacecraft manufacturer Business development and engineering departments |
Constellation and satellite design collaboration The manufacturer needs cross-departmental and external collaboration to secure a major D2D deal. |
NCAT enables the collaborative, multi-tool simulation of various constellation designs and their commercial impact. Its visuals, analytics and shareable data support effective internal co-ordination and compelling external communication, thus contributing directly to winning the contract. |
|
Ground equipment manufacturer Chief financial officer (CFO)’s office |
Market addressability and business case The CFO needs to understand where, and how many, ground systems can be sold based on global and country-level satellite demand. |
NCAT provides detailed insights into constellation coverage, capacity and market demand. This data feeds directly into revenue forecasts, manufacturing planning and RoI analysis for new product lines and target clients, thus translating technical capabilities into clear financial projections. |
|
Defence contractor Engineering and programme management offices |
Capacity analysis and client-facing support The contractor needs to assess multi-orbit architectures to meet resiliency and operational needs in defence environments. |
NCAT delivers detailed insights into satellite visibility, coverage continuity, link latency, territorial system capacity and overall network resilience. This supports mission-critical planning and effective communication with defence stakeholders. |
Examples of satellite systems included
Amazon Leo, AST SpaceMobile, Blue Origin's TeraWave, E-Space, Eutelsat's OneWeb, G60 Thousand Sails (Qianfan), Globalstar, Iridium, Kepler, Lynk Global, Mangata Networks, Rivada Space, SES mPOWER & O3b, SpaceX Starlink (broadband and D2D/D2C) and Telesat Lightspeed

Subscription content
Log in to check if this content is included in your content subscription.
Login

Author